- Home
- Azure Data
- Azure SQL Blog
- Use case scenarios for the new SQL Managed Instance Hardware Offerings
- Subscribe to RSS Feed
- Mark as New
- Mark as Read
- Bookmark
- Subscribe
- Printer Friendly Page
- Report Inappropriate Content
We want to share with you a couple of scenarios where the workloads benefit from the new hardware offering on Azure SQL Managed Instance. If your workload will benefit from higher memory to CPU vCore ratio, consider the newest hardware offering worth checking out.
As you know, at Ignite 2021 Fall we have announced the 2 new Hardware offerings for Azure SQL Managed Instance - Premium series with 7 GB of RAM/vCore and Premium series - Memory Optimized that offer 13.6 GB of RAM/vCore.
We do not attempt to list all possible scenarios, but we have chosen the following 2 that some of our SQL Managed Instance customers are facing, once reaching the memory limits of the currently available hardware offerings:
- Individual Memory Intensive Queries
- Running many Parallel Queries
Setup
We have taken a TPC-H 300 GB database, where fact tables contain Clustered Columnstore Indexes and are optimized for the Data Warehousing fast data processing.
We did not change any settings on the SQL Managed Instance itself, using them right ‘out of the box’ after deployment.
We have restored this database backup to our 3 Azure SQL Managed Instances each one using Business Critical service tier with 8 CPU vCores and with 1 TB of Reserved Disk Space – Standard-series, Premium-series and Premium-series Memory-Optimized.
Individual Memory Intensive Queries
We have taken one particularly memory intensive TPC-H query and modified it slightly by returning the biggest revenue result and increased the range of data from just 1 year to 20 years, which is a normal amount of data for big Data Warehouse workloads:
SELECT TOP 1
    c_custkey,
    c_name,
    sum(l_extendedprice * (1 - l_discount)) as revenue,
    c_acctbal,
    n_name,
    c_address,
    c_phone,
    c_comment
FROM
    customer,
    orders,
    lineitem,
    nation
WHERE
    c_custkey = o_custkey
    AND l_orderkey = o_orderkey
    AND o_orderdate >= '1993-10-01'
    AND o_orderdate < '2013-10-01'
    AND l_returnflag = 'R'
    AND c_nationkey = n_nationkey
GROUP BY
    c_custkey,
    c_name,
    c_acctbal,
    c_phone,
    n_name,
    c_address,
    c_comment
ORDER BY
    revenue desc;
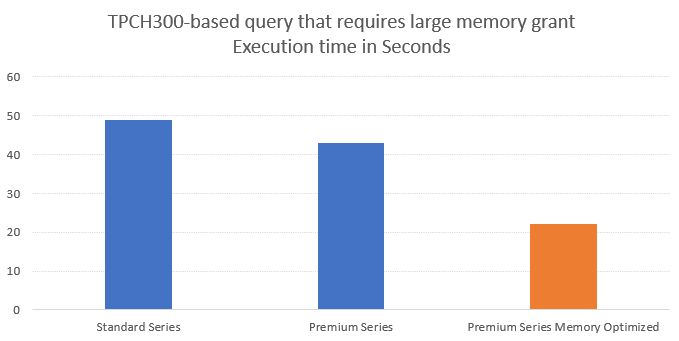
Running this query on the SQL MI BC Standard-series takes around 49 seconds after warm-up and produces the following execution plan that contains 1 spill operation for the Hash Match inner join operation.
The problem is caused by the lack of the available memory. The memory grant that was given for processing the data is 6216 MB, that is by far not enough for this query. It resulted in almost 680.000 pages spill into TempDB, hindering the performance greatly.
On the SQL MI BC Premium series hadware oferring the situation changes and on the first sight it gets worse, since not just 1 but 2 Hash Match operations are not getting enough memory to execute their operations (Inner Joins & Aggregate), when in reality the execution time lowers to 43 seconds on average.

By running this query on the SQL MI BC Premium-series Memory-Optimized hardware offering, the first thing you will notice is that it takes just 22 seconds with the following execution plan that suffers no TempDB spilling problems as you can see on the execution plan below:
The memory grant has been scaled to the whooping 18 GB instead of under 9 GB that was given for the Premium Series, and that amount was enough to process the data without interaction with TempDB – and thus improving the overall performance almost 2 times.
And on the picture below you can see the overview between the execution differences for each of the selected offerings:
Running many parallel queries
For the second scenario we have opted to run many parallel queries to see how the SQL MI will behave and process them. To make it simpler, we have chosen another TPC-H based query that we have put inside a Stored Procedure as indicated on the code below:
CREATE OR ALTER PROC dbo.GetAnalyticsDemo AS
BEGIN
	SET NOCOUNT ON;

	SELECT 100.00 * sum(case
				when p_type like 'PROMO%'
					then l_extendedprice * (1 - l_discount)
				else 0
			end) / sum(l_extendedprice * (1 - l_discount)) as promo_revenue
		FROM
			lineitem,
			part
		WHERE
			l_partkey = p_partkey
			AND l_shipdate >=  '1995-09-01'
			AND l_shipdate < '1995-10-01';
END
That was done to simplify the example, given that each of this queries/stored procedures will ask for a Memory Grant of around 3.5 GB of RAM. This allow us to exhaust very fast the available amounts of RAM and respective memory grants for each of the SQL MI instance hardware offerings without going into hundreds of parallel queries.
To execute the queries in parallel, we have used the RML Utilities for SQL Server - Update 2021 with a traditional tool for the parallel workload testing - the ostress.
Below is the invocation code that I have used to execute the workload and if you are trying this scenario, please do not forget to substitute the name of the instance, the username and the password to the real ones.
ostress -S"MYSUPERMIINSTANCEDEMO.public.123456notvisible.database.windows.net,3342" -Q"EXECUTE TPCH300.dbo.GetAnalyticsDemo;" -n15 -r3 -UsecretUser -PMj3243NGFik234??!@M#
For this test we decided to run 15 users in a loop with 3 repetitions, making sure that the queries won't finish right away until I would test them through.
For observing which queries get a memory grant and which one are stuck, I have used the following query, extracting the information from the sys.dm_exec_memory_grants DMV:
SELECT sqlt.[text] as QueryText
	  , CAST(((t1.requested_memory_kb)/1024.00) AS DECIMAL(9,2)) RequestedMemoryMB
	  , CAST(((t1.granted_memory_kb)/1024.00) AS DECIMAL(9,2)) GrantedMemoryMB
	  , CAST(((t1.used_memory_kb)/1024.00) AS DECIMAL(9,2)) UsedMemoryMB
	  , CASE WHEN t1.grant_time IS NULL THEN 'Waiting' ELSE 'Granted' END AS RequestStatus
	FROM sys.dm_exec_query_memory_grants t1
		CROSS APPLY sys.dm_exec_sql_text(t1.sql_handle) sqlt
	ORDER BY RequestStatus DESC;
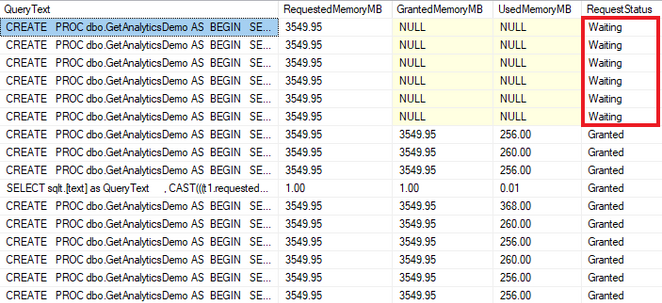
On the Standard series hardware offering the picture is quite clear - just 6 out of the 15 queries are getting their memory grants in parallel:
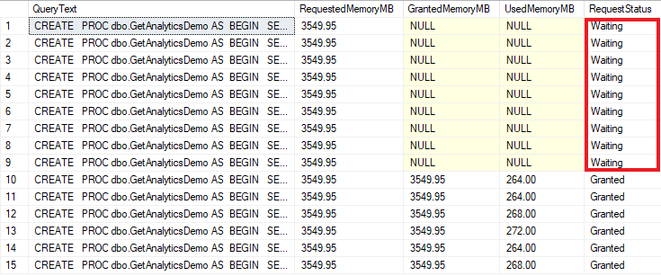
On the Premium series hardware offering, we observe that the number grows up to 9 queries, meaning we have a potential 50% capacity increase:
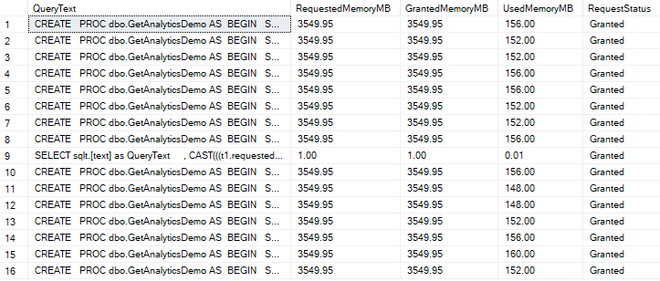
On the Premium series Memory Optimized hardware offering, all queries get the requested memory grants and every process will be able to advance:
The key role of operational memory in databases has been always a factor of achieving the highest performance for the memory intensive workloads and the new Hardware offerings for Azure SQL Managed Instance can certainly allow your memory hungry workloads to achieve new heights without scaling up the number of CPU vCores, which is certainly the best solution for the customer.
You must be a registered user to add a comment. If you've already registered, sign in. Otherwise, register and sign in.


